The Dashboard is the first thing you see on the Personal side of Barnaby. It shows what came in, what went out, how your spending breaks down by type, and what’s been left out of your totals, for whatever stretch of time you pick. Here’s how to read it.
1. Your money at a glance
This side of Barnaby isn’t about tax. Nothing here goes on a tax return. It’s simply a clear picture of your own money.
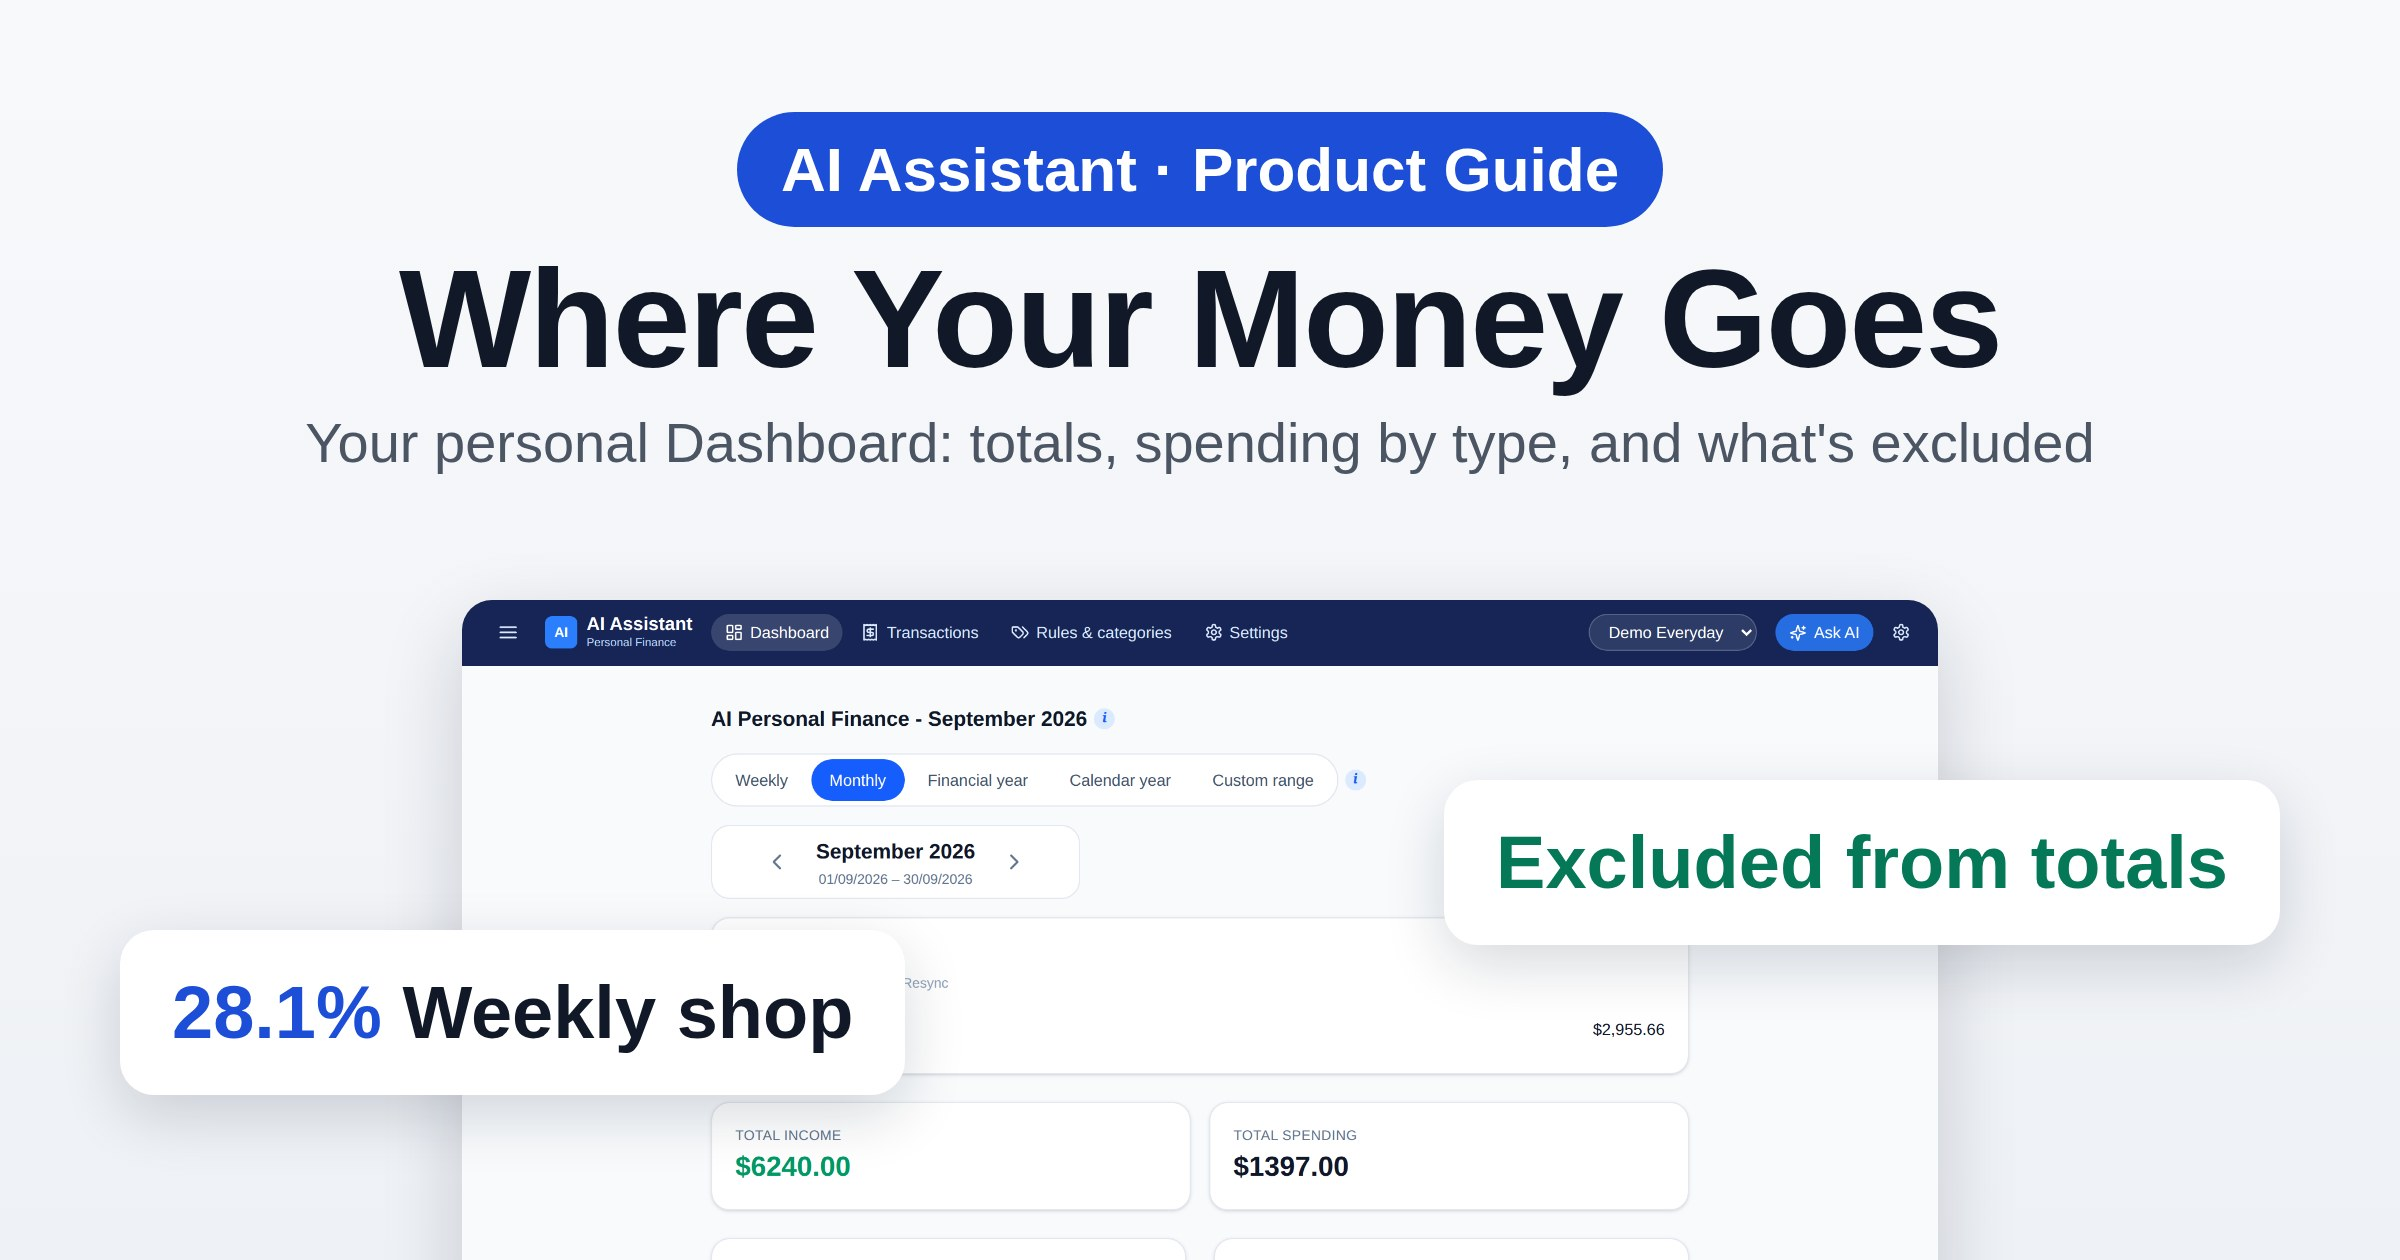
Open Personal and you land on the Dashboard. If you keep more than one personal account, pick the one you want from the switcher at the top right.
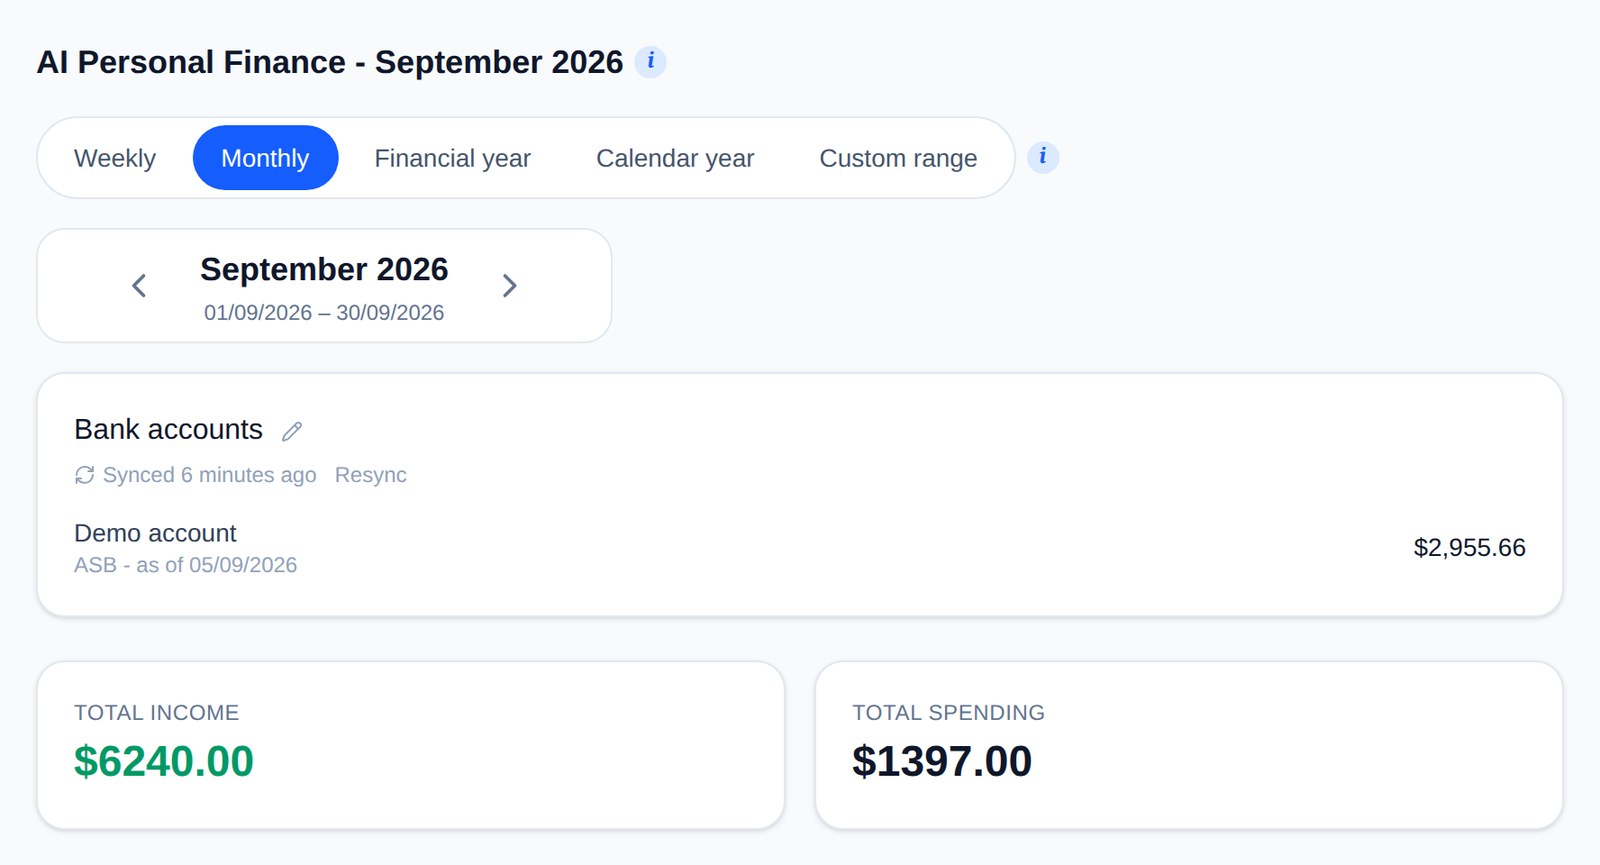
Once a bank is linked in Settings, Bank accounts shows each account’s latest balance and when it last synced. It syncs again automatically every hour, and Resync does it straight away.

2. Pick your period
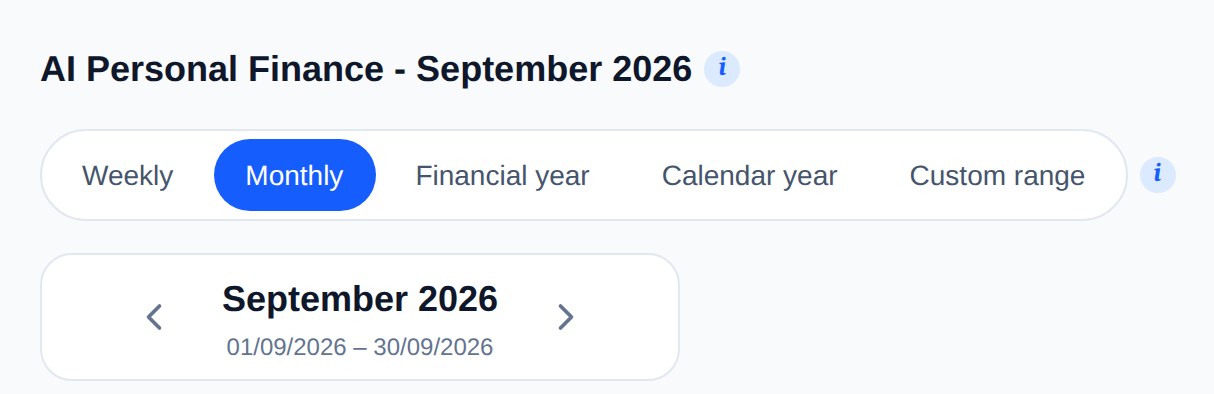
Choose the stretch of time you want to look at: Weekly, Monthly, Financial year (1 April to 31 March), Calendar year or a Custom range of your own dates. The Personal side starts on Calendar year.
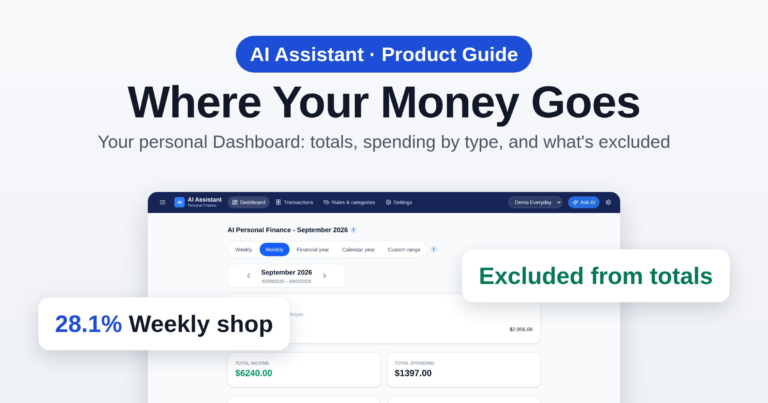
The arrows either side of the date step back or forward one week, month or year at a time, and everything below updates to match. The examples here are for one month, September 2026.
3. The totals
Total income and Total spending add up every transaction in your listed categories for the period you picked. Anything in a category you’ve excluded from totals is left out of both — more on that below.

4. Where your money goes
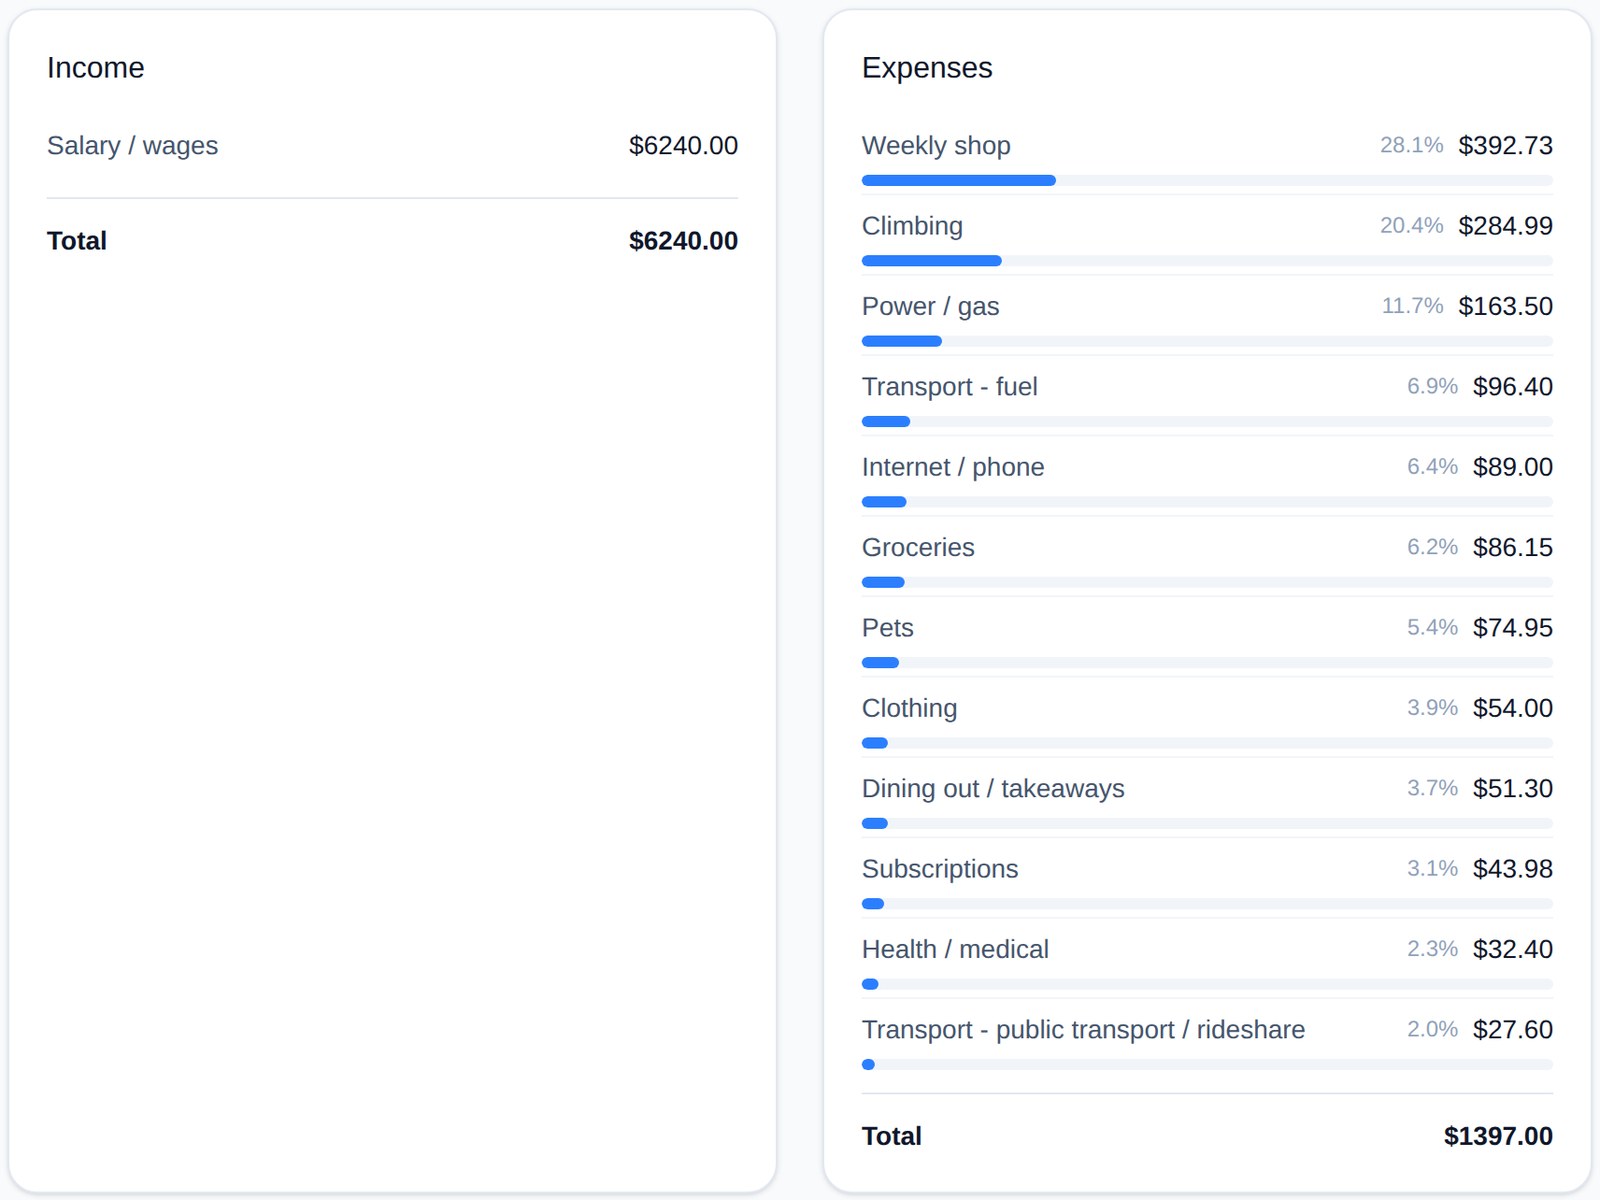
Underneath, your spending is broken down by type, one row per category, biggest first. Each row shows how much went on it and what share of your total spending that is, with a bar so the big ones stand out. In this example the weekly shop is 28.1% of the month’s spending.
Income is broken down the same way, one row per income category, with its total at the bottom.
5. Look behind a number
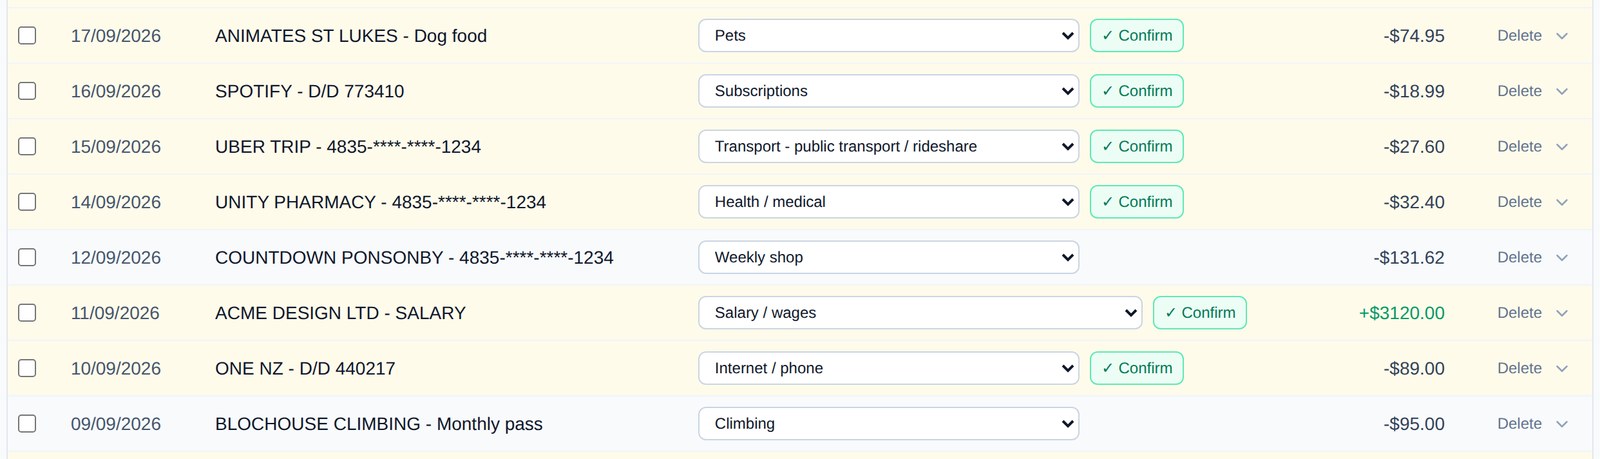
Click any category to see the transactions behind it, with their dates and amounts. Click it again to close it.
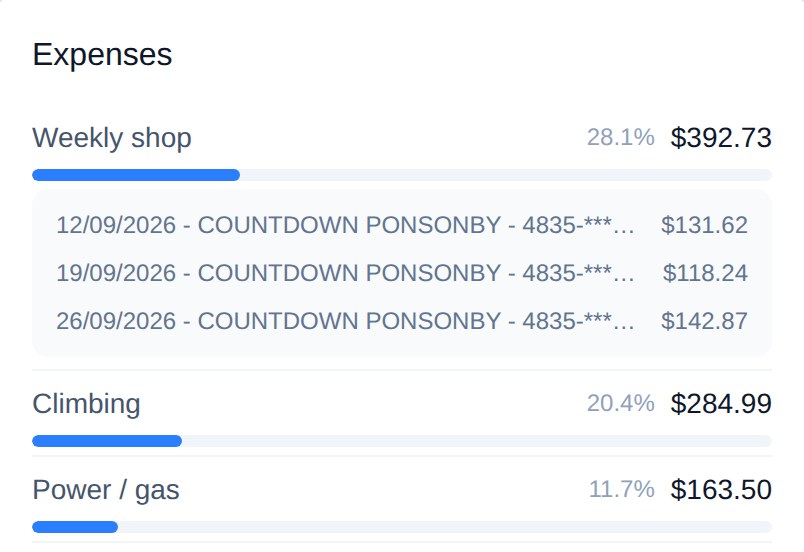
Click one of those transactions and it opens on the Transactions page, scrolled to that row, ready to check or change its category.
6. What’s excluded
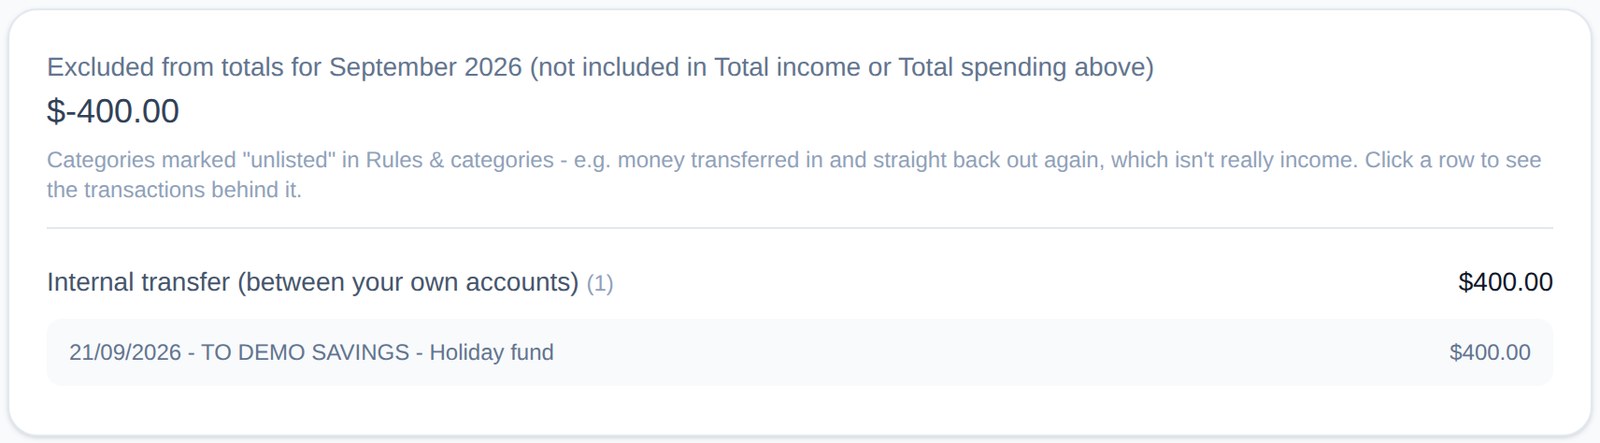
Some money isn’t really income or spending, like moving it between your own accounts or into savings. Categories marked as excluded from totals are kept out of Total income and Total spending, so they don’t blow them out.
Nothing is hidden, though. Whenever the period has any, they get their own Excluded from totals card at the bottom of the Dashboard, with a row per category and how many transactions are in it. Click a row to see what’s in it.
7. Make it yours
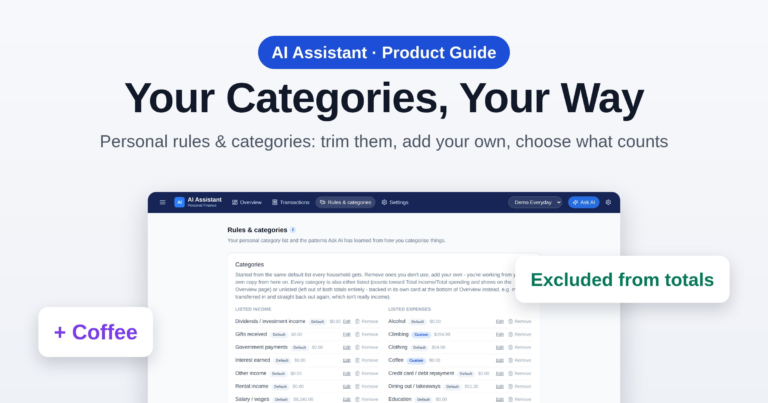
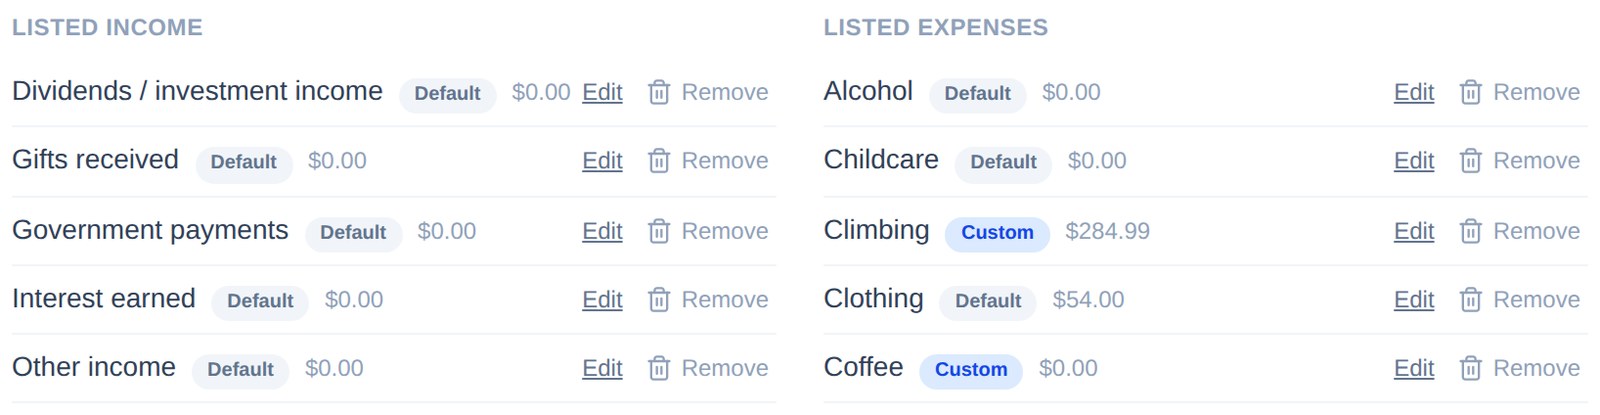
What counts toward your totals, and what’s left out, is entirely up to you. Change it any time in Rules & categories: every category is either listed or excluded from totals, and you can add your own, remove ones you don’t use, or switch one over. The Dashboard follows straight away. See Personal Rules & Categories: Track Your Money Your Way for the full walkthrough.
See where your money goes
Bring your transactions in and get a clear picture of your own spending and income.
Get startedScreenshots use a test account with made-up transactions. Barnaby’s personal side is for keeping track of your own money; it isn’t financial advice.